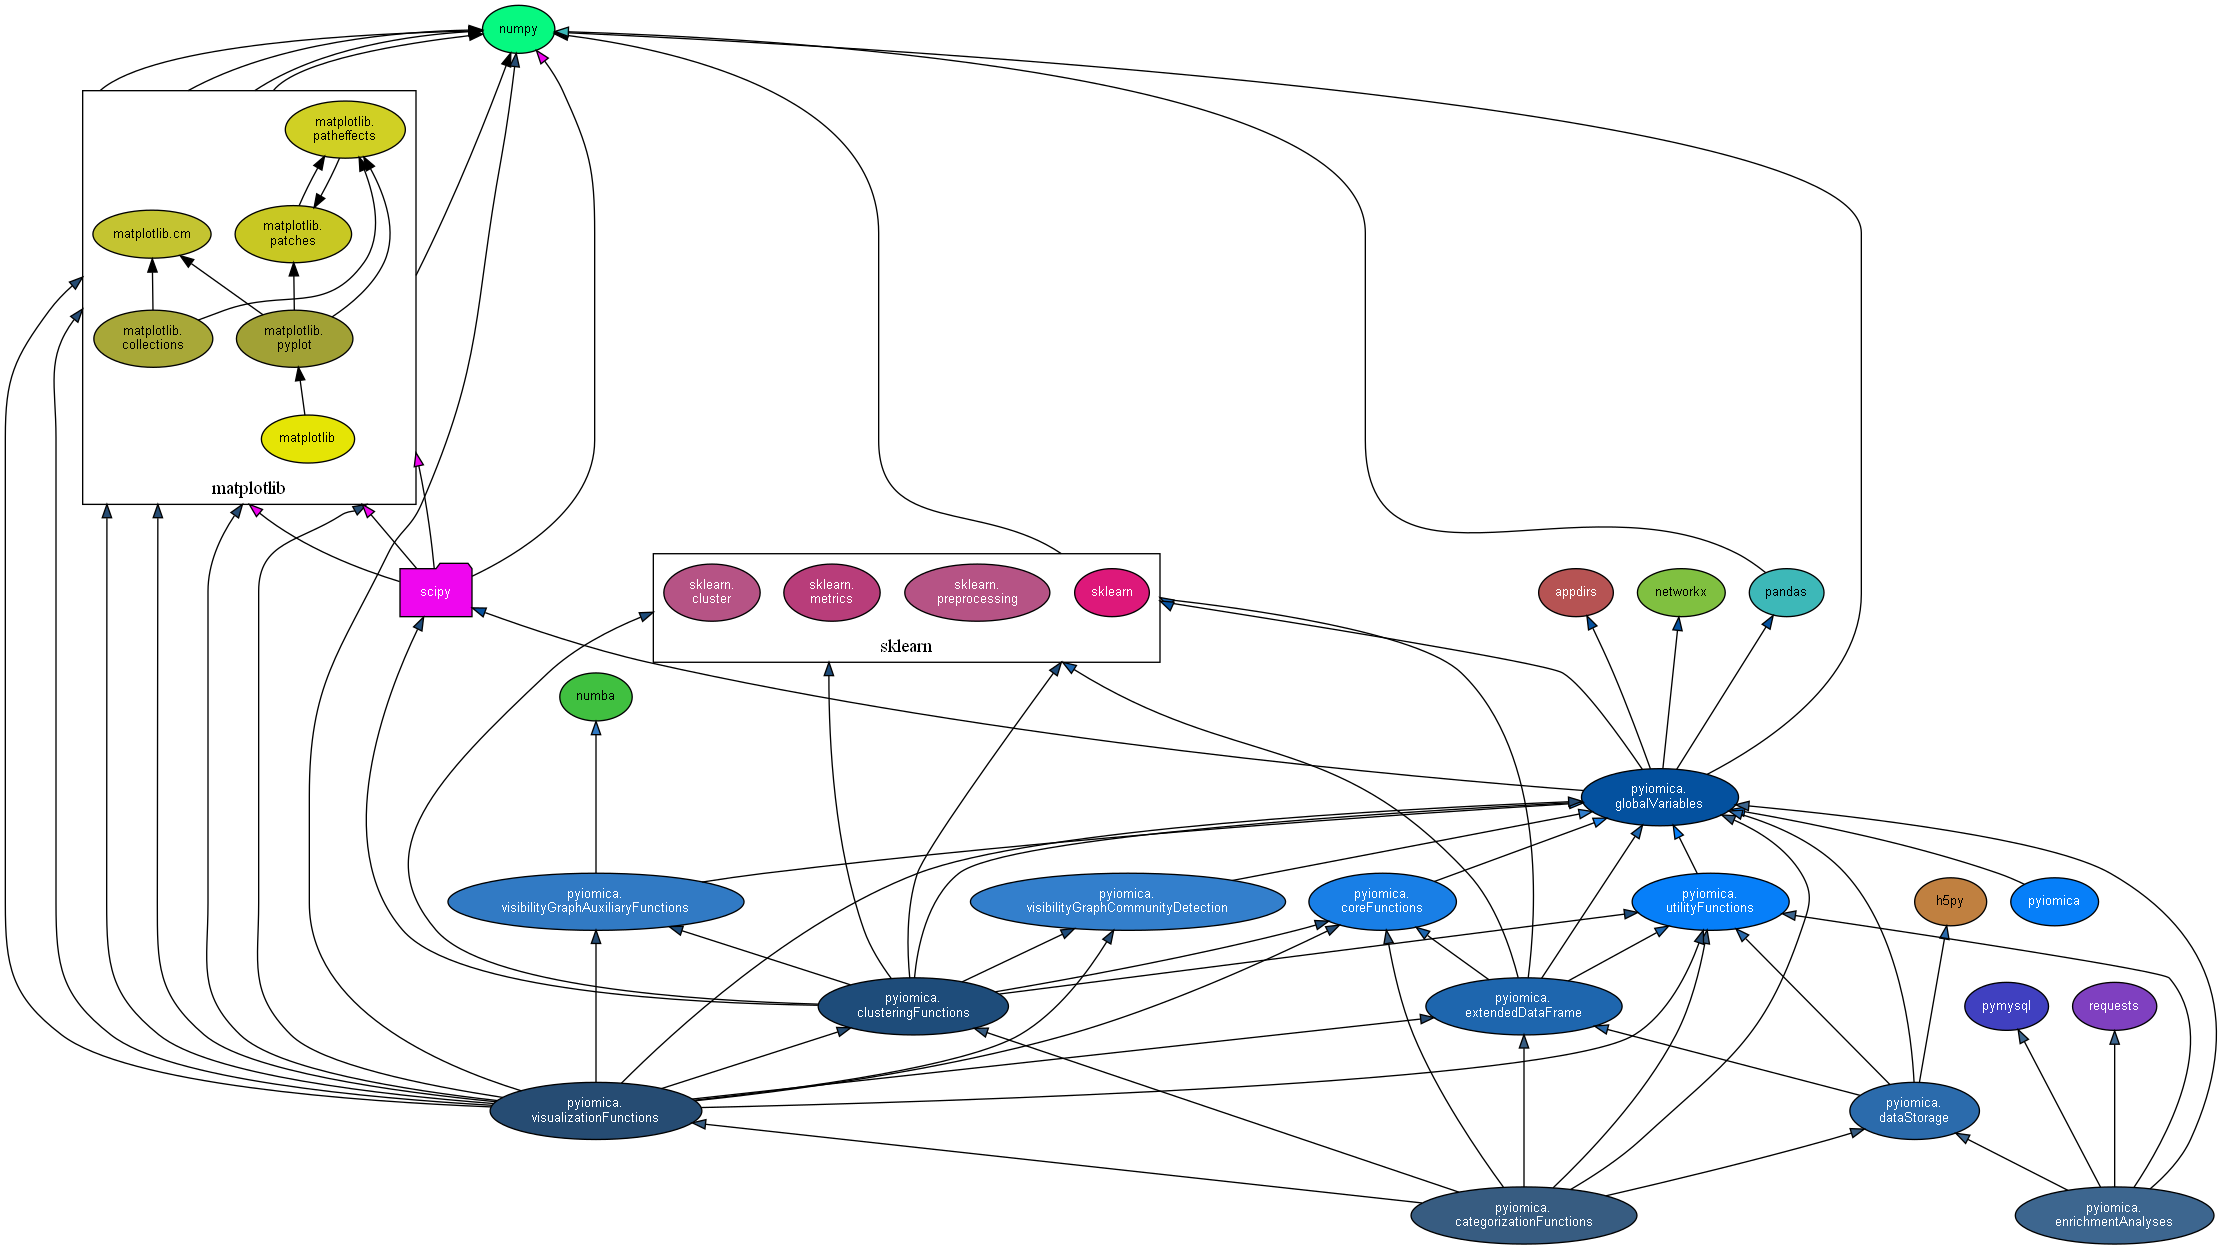
4. Dependencies
This graph was generated with Python module dependency visualization tool pydeps, see GitHub, by running the following (after installation of the necessary components):
pydeps pyiomica --reverse --max-bacon=2 --cluster --max-cluster-size=6 --min-cluster-size=2 -T=png -o=docs/pyiomica_pydeps_current.png
pydeps pyiomica --reverse --max-bacon=2 --cluster --max-cluster-size=6 --min-cluster-size=2 -T=svg -o=docs/pyiomica_pydeps_current.svg